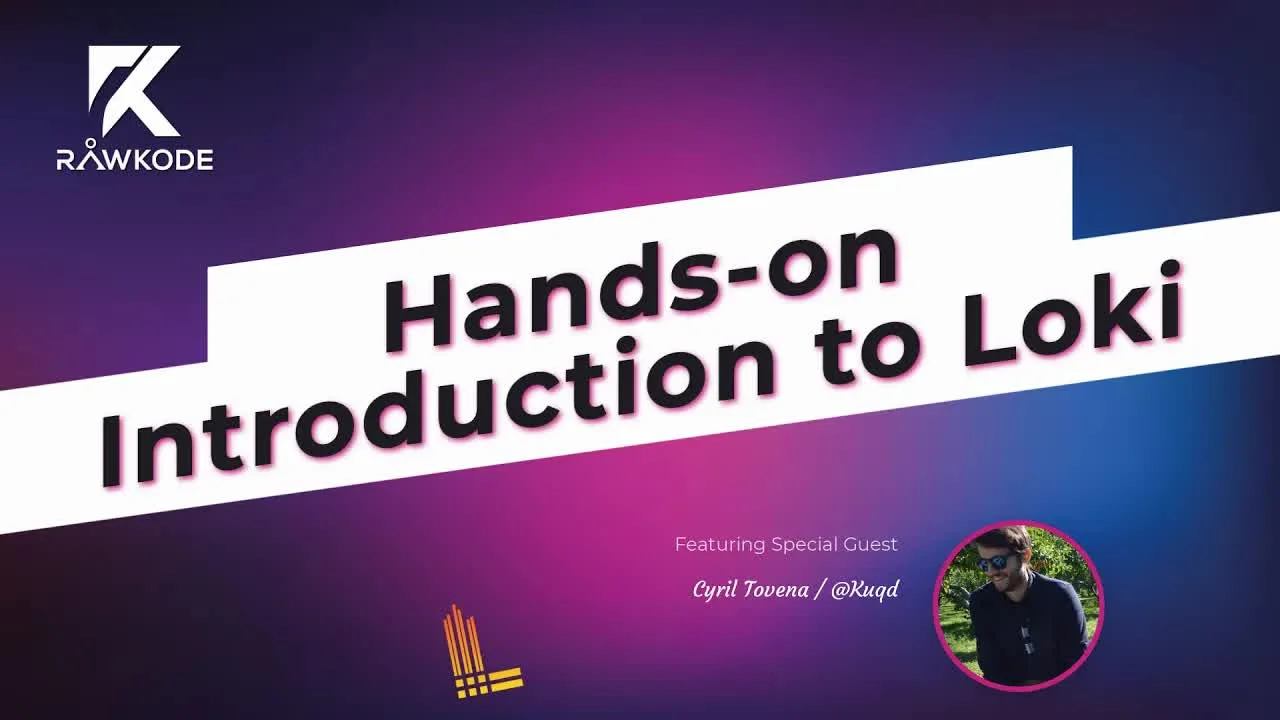
About this video
What You'll Learn
- Compare Loki deployment architectures and storage patterns for production and local Kubernetes environments.
- Install a Loki stack with Helm and configure Promtail log shipping into a live demo namespace.
- Query Sock Shop logs in Grafana with LogQL, labels, parsing, and metrics dashboards.
Cyril Tovena from Grafana Labs walks through Loki hands-on: installing the Loki stack on Kubernetes via Helm, shipping logs with Promtail, and querying the Sock Shop demo with LogQL filters, parsers, and metric aggregations in Grafana.
Jump to a chapter
- 0:00 Holding Screen
- 0:50 Introductions
- 0:51 Introduction to Loki
- 1:06 Housekeeping and Sponsor Thanks
- 2:01 Guest Introduction and What is Loki
- 2:50 Loki Architecture and Storage Options
- 5:30 What is Loki?
- 6:07 Cluster Setup and Installation Methods
- 9:09 Choosing the Helm Chart and Promtail Explained
- 10:00 Deploying Loki
- 13:05 Installing the Loki Stack with Helm
- 18:09 Accessing Grafana and Exploring Logs
- 21:45 Introduction to LogQL
- 22:25 Introduction to LogQL and Grafana UI
- 30:20 Grafana's Log Browser
- 32:43 Exploring Logs with Log Browser and Sock Shop Example
- 41:05 LogQL Metric Queries and Filtering Log Content
- 41:20 Aggregations with LogQL
- 45:00 Searching with LogQL
- 51:03 Building a Grafana Dashboard with Metrics and Logs
- 54:00 Dashboards and Panels with Loki
- 1:03:10 LogQL Parsing, Extraction, and Transformations
- 1:04:00 Parsing Logs with LogQL
- 1:21:33 Extracting Metrics from Logs using Unwrap
- 1:25:00 Metrics from Logs
- 1:31:37 Conclusion and Wrap-up
Full transcript
Generated from the English captions. Timestamps jump the player to that moment.
Read the full transcript
0:51 Introduction to Loki
0:51 Hello, and welcome to today's episode of Rawkode Live. I'm your host, Rawkode. Today, we're gonna be taking a look at Loki, a tool for collecting logs on bare metal Kubernetes and a whole bunch of other things from the team at Grafana. Now before we get started and dive into Loki in a little bit more detail and get hands on, we just got a little bit of housekeeping. First and foremost, please, if you're not already subscribed to the YouTube channel, do that now. Use the bell to get notifications for all future episodes. If you're not watching live, but you wanna
1:06 Housekeeping and Sponsor Thanks
1:24 have a little bit of a conversation about what you see in today's episode or any other episode, then you can join the Discord server. We've got a couple of hundred cloud native enthusiasts and Kubernetes people all talking about cloud native technologies and general technologies. Come and join us, get involved. And lastly, I wanna thank Equinix Metal. They are my employer, but they allow me to spend time during my working day producing this channel and these episodes so that we can all learn the vast cloud native landscape together. So thank you Equinix Metal. You can use
1:53 the code Rawkode for $200 off compute. You can spend that on just fifty hours or four hundred hours. That is entirely up to you. Have some fun. Right. Now today, I am joined by from the Grafana team, maintainer of the Loki project. Hi there. How are you? Hello. Hello, David. Hi. I'm good. Thank you. And you? Yeah. I'm doing really well. Thank you. Actually, I mean, I'm excited to dive into Loki and and see how it can improve my logging pipelines. So very excited to take this session. Nice. Do you want to give us a brief
2:01 Guest Introduction and What is Loki
2:25 introduction about yourself? And then we'll kind of talk about Loki and what it is. Yeah. Sure. So I've been working at Grafana for two years now, and I'm a software engineer there. And I've mostly been involved with Loki, a bit of Cortex, but mostly Loki. So I'm Loki expert, so don't hesitate to ask any question regarding Loki. Nice. Awesome. So why don't we kinda just talk about, like, what is Loki? Like, what what what give me the, like, the the three word patch if there is one. What does Loki do? Oh, three three word. That's I'm gonna need
2:50 Loki Architecture and Storage Options
3:04 a little bit more. But Alright. Alright. I'll give It's actually, it's five words. Five words. Good. It's like properties it's like properties, but for the dogs. That's that's the idea. But, no, more seriously, it's a log aggregation system where you can send all your application logs to, and it will aggregate all of them in a central place where you can, you know, query them back. And it's heavily inspired by Promotus. One of the big difference that it takes compared to other system out there is that it doesn't really index the content itself, just the metadata. A bit like
3:47 Prometheus, you know, the the the labels, how they work. In Loki, the idea is a bit the same. You index only the labels itself of the of the of the workload, so not the content. And that makes it, you know, very, inexpensive to run, because the index is very small at the end of the day. In some system, you can end up with an index that is actually bigger than the than the content itself. And so in that in that case, that makes the operational workload very, very difficult. And I think, Loki, that's that's what it's
4:21 nice with Loki. It's bit easier to run. Is it is it easier to run and is it is it to scale too? Is it is it fair to say that Loki then is a database? Is that the correct way to look at it? So yeah. I mean, we since it has its own Loki language, I guess we could say that it's a database. The thing to note, though, is we rely on on giants. We we mostly allow people to save data in in object storage, like Google Cloud Storage or s Amazon s three. So we're not, like,
5:00 really storing the data ourselves, but we do replication to make sure that, you know, when you ingest the data, we don't lose if the data if there's any any node that is going down. We so that's, yeah, that's the that's the idea. You can also store the data on disk if you're in running the single binary, and I believe that's what we're gonna do today. In that case, you know, it's it's it's more for a single cluster. So if you need to scale above that, like you have a lot of cluster, you're probably gonna want to look at using an
5:30 What is Loki?
5:34 object store. It's gonna be easier anyway to to operate. Right? It's it's it's easier than PVCs. I'm pretty sure, like, everyone out there knows, you know, how difficult it can be to operate a stateful set and PVCs. Yeah. I'm I'm sure anyone watching who's run stateful workloads in Kubernetes knows exactly how easy all of that stuff is these days. Right? Yeah. Hopefully, the sarcasm can clear loud and clear there. Stateful workloads are are as much as I encourage it in Kubernetes, still a pain in the ass. But let's get my screen shared. We have here the
6:07 Cluster Setup and Installation Methods
6:09 Grafana Loki webpage and documentation. Yeah. There's the, like, Prometheus but for logs line that you gave me with the file. Exactly. So I I mean, I kind of compared it to database, but even in the the first line here and I know it's a little bit small, so let's just zoom in. But it says Loki is actually a set of components that can be composed in the fully featured logging stack. So do you wanna break that down us? What are the what are the components of Loki? Yeah. So the so there's no super way to run Loki.
6:42 Today, we're just gonna do a single binary, a bit like Promotus, which only scale vertically. And that's already good enough for a single cluster. But in fact, we created Loki for our own usage on Grafana so that we can receive terabytes of data from customer around the world. So Loki can also scale using a distributed version, which is splitted into multiple components. So there's you know, there there there's a lot of different component in in the system. But the idea is there's a distributors that will receive the data and validate the data, then it will pass
7:21 it down to ingestors. Ingestors are are basically compressing the data and saving that in the object store. And then after, you know, you have the quarries that will query back the data. Yeah. So this schema here that we're looking at is a bit summarizing what I'm saying. There's two ways to unlock it. Today, we're just going go with the simple one. There's a more complex one. If you're really into it, you have time, you you know, wanna you wanna run Rookie with at very large scale, then then you can use that. Is that these these are the components you mentioned. Right?
8:02 Distributor and JS, query front end and and query. And this is all documented in there. Well, quite easy to find it through the documentation. Exactly. Yeah. If you wanna know more, I guess we we're not gonna go through too much into this because, you know, like every distributed system, it's kind of complex. We could talk for hours about this. Yeah. But that's that's the idea. It's nice to talk about it and to have a nice overview of the different components, the potential architectures. But, you know, we we really just wanna get a hands on with this, don't we?
8:34 We wanna kick the tires. We wanna play with it. We wanna see how cool it is. And people can, in your own time, feel free to jump into the docs and do a bit of a deeper dive there. Yep. Yeah. There's there's lots going on here. So There is a lot of documentation about it. We try to be very transparent about what we're we're building here. Yeah. Good documentation is something that I love to see on this show. I wish it was, like, the the standard for all open source projects, but that's not the case. And I'll include my own in
9:02 that. My documentation for all of my projects is the worst documentation in the world. So I really appreciate it when I find other projects. It's a it's a team effort, and we recently got a new hire in the team who's gonna who's actually a technical writer. So he's gonna spend a lot of time improving this documentation. So all of this has been written so far by developers. You know Nice. It is how it is. Okay. So we are gonna I have prepared let's do the what have I done upfront component of the show? I have a Kubernetes
9:09 Choosing the Helm Chart and Promtail Explained
9:36 cluster running on Equinix metal. It has nothing on the default namespace, but we do have the weave works. Oh, where's my Why is it not all complete? Oh, there we go. We do have the weave works sock shop microservice demo deployed to the cluster. I just did that to create some arbitrary noise, hopefully get some logs into Yeah. Into Loki. We made it say to deploy something else, that's perfectly alright, but I just thought I'd give us maybe a little bit of a head start with some of the boring stuff there. And of course, we do have
10:00 Deploying Loki
10:07 the control plane if we wanna get the logs out of that too. And something you mentioned as we were chatting just before we went live is that you can get quite meta with this. Loki can read its own logs. Yeah. I'll have a a little bit of fun with that as well. There's various installation methods. We can go with with Tanka. I think I'm gonna avoid that today. I think the whole Tanka thing is something we could do an entirely own episode on. Yeah. What Tanka is and how to do it. Do you wanna share anything about Tanka before
10:36 we jump into helm though? Do you want to give us, like, more Yeah. That's mhmm. Yeah. TANCA is is it's really the same purpose as Helm as, you know, deploying, you know, describing your infrastructure and and your workload with code, except that we use Gsonnet and not I think it's what's the the template the Go template, I think. Go template. Yeah. But yeah. And so with Tinker, we use Gsonnet, which is a language that is a bit more flexible. But it's also less well known and a bit more difficult to learn. But it has this nice flexibility.
11:16 And that's what we use at Gafana Labs to deploy all the workload that we have. So that's why the we we recommend Tenka because, you know, there's more chance that you're gonna have, you know, the latest version because we we try to always make Tenka up to date. But Elm is more like a community, so we don't we don't, you know, we don't we don't ourselves look at Elm that much, and we don't run it with Elm on our side. So it's easier for us to help you if you're using Thinker. But Elm, you know, I've I've
11:47 been using it too for deploying Loki for testing, and it's it's it's working, you know, like a charm too. Nice. Yeah. I mean, I'll I'll kind of add one thing here. I I I think Helm is great, but I really dislike Go templates. And I find it really difficult to maintain my Helm charts with the amount of options that users want while trying to make it still legible, readable, understandable, all these things. It can be really difficult and I I love seeing your tooling in this space come up to try and hopefully solve some of those challenges. Yeah, I'd love to
12:18 do a Tanker episode one day for sure. Yeah. One of the one of the big win that I like with Tanker, this is something that happened to me a lot in in my previous experience, is how many times have you deployed an application in the wrong cluster, like in production? Or you applied applied the change because the context your context was not the right one. Tenkara doesn't really rely on on your current context. It relies on the context that is set in the folder. So of you know? There's a gist there's a JSON file that
12:52 describes the the cluster that you should be targeting for that folder. And it will always, you know, target that one. So there's less chance to make a mistake, like deploying an update in pod or removing a pod in pod or anything like that. Yeah. I I do that all the time. I am juggling so many clusters for these episodes, for my day job, for my open source projects, and I should get better at using Dart End and having KubeConfigs thrown around or even just better tooling my context. But I I do it all the time. I'm always deploying
13:05 Installing the Loki Stack with Helm
13:22 stuff to Docker for Mac because I mean to put somewhere else or to the wrong yeah. I feel that. Yeah. Okay. Let's jump to the You to do Docker format and Docker format and instead you deployed prod. That's too awesome. Take care of it. See, because I also have a show called Clustered where I have to spend up to multiple clusters every week, and one of the things I keep doing is deploying Cluster API to my production cluster instead of Docker for Mac, and it's it's it's a pain in the ass. Anyway, I'm gonna rant about that
13:47 another day, not today. What we'll do today is add our helm repository. Yeah. Don't have to check my context because I already ran get nodes and get pods. I'm good. Okay. You you gave me the fear now. Run our repository update, which I don't think I probably needed with the repo ad, but it's all good. And what I see here is we have a couple of options for deploying locator or cluster. Mhmm. We've got something called a Loki stack. We've got a Loki stack over PVC. We've got a slightly different Loki stack. Yep. You wanna run us through these options
14:22 if you don't mind? Yeah. They're they're just so Loki stack is really an umbrella chart, And a lot of people are using it just to get started and and play with the the whole stack of Loki, Ponte plus Grafana and and added bonus parameters too. So all of those different type of installation just, you know, activate, deactivate one of the component or or or persistent volume or depending on what you're looking for. You can even just use if you want to instead of. So this is just Viya's. It's it's the same stack, but with Viya's,
14:56 you know, configuration enable and disable. I would suggest that we go with the, yeah, the one you have your mouse on, the one that's deployed in Skafana and Prometheus. Yeah. Let's go with this one. So for I know what FluteBit is. I I know I've I've used that a fair bit in my career. I have never used Promptail. Can you give me the what what is is that just a Yep. No. That's a very good very good question, David. The the the idea of of is, you know, there's already a lot of client for fetching logs, but there's none of them
15:29 that really mimic the service discovery from Prometheus. Right. And that's all the reason why we have Prometheus. We wanted to have the same experience as you will install Prometheus, configure your labels to be extracted and fetched with the Kubernetes service discovery. And Prometheus is exactly the same configuration. So you have more chance to have the same label set for the workload for your logs and your metrics if you're using Pontail than using Finbit. It's a bit more difficult. I'm not saying it's impossible, but it's going to be more difficult. If you're coming from Prometheus world, Prometheus
16:05 will be much more easier to configure. Alright. Awesome. Thank you for that. Okay. So we're gonna deploy Loki Loki stack with Prometheus. Now I'm curious. One last thing and we'll get on to something a bit more interesting, but we have an option for web and without a PVC. I'm going to deploy the one without even though we do have the ability to have persistent volumes on our cluster, but I'm just curious if I do it without the PVC, does that mean if Loki restarts, we lose our data, or is it using host path or something else?
16:36 Yeah. No. I I don't think it by default, it uses all sparse, so you will lose the data if you restart. Yeah. And we're okay with that for today. Right? So Yeah. We're okay with that. Yeah. Definitely. I never told you. We're deploying this into prod today for my real work cluster. So I should probably use PVC. Exactly. You want to use PVC if you're, yeah, if you're deploying on a production cluster or anything like that. Alright. So does this create no namespace? I'm assuming we've got some stuff in our default. There we go. Nice. Yeah.
17:09 Everything is starting. Yeah. So I see Loki zero. That means we've got a stateful set running here with with one pod. I'm gonna assume we've got Grafana. Yeah. KubeStateMetrics. Nice. We don't have to deploy that. That is always a win. We've got the Prometheus stack that we're all know and comfortable with. And then we have Yep. Promptail, four of them. I'm assuming that is a daemon set based on the It is. Yep. Correct. Yeah. I know some stuff. I'm not, you know, not really rubbish. No. So the idea is Pontail is going to run on each of the nodes.
17:44 And it's going to need so by the way, I hope that this is going to be fine. But it's going to need to access the host path of the nodes so that it can get the Docker logs from the daemon itself. And then it's gonna tail those files. And with the service discovery, you're gonna be able to attach Kubernetes metadata to the logs and send them to Loki. Awesome. Well, let's give that just a a moment to kinda get healthy, get happy. We do have a question from our audience. I'm gonna pop that on the screen.
18:09 Accessing Grafana and Exploring Logs
18:16 But Raja Sulent has asked there's not read the manual pages yet, but I do love the use of RTFN by the way. Props to that. I cannot use this to create a dynamic oh, no. See, I was too busy enjoying the RTFM. But can I use this to create a dynamic dashboard with logs that I put into the system so I can get a dashboard to view the logs? So does that make sense to you? Can I Hold on? I'll pull it back up one more time. I think what they're asking is is can I use this to create a
18:45 dashboard that just shows me the logs that I'm putting into the system? I think that is You yeah. You can create a dash yeah. You can create a dashboard. So, yeah, Grafana now supports a log panel. So not only you can use explore to directly explore the logs of your workload, but you can also build the metric dash dashboard that you you were before and then add the logs within well, we're we're gonna be able to do that today, I think. That's gonna be fun. That sounds like a great idea. I guess alright. Let me throw it. Okay. We've deployed
19:14 this. And I know I should go back to the docs, but I've got you right in front of me, so I'm just gonna throw at you anyway. Yeah. Because we have the Promptail running as a daemon set, because we have deployed this altogether, I'm assuming if I just browse to Grafana, I would expect Promptail to already be shipping all of my containers logs to Loki, and that we can probably start to query that right away. Is is that where we Yeah. I expect the same thing, but, you know, how it is live. So let's see. Yeah.
19:41 I expect that normally when you when you get the the stack working, you should be able to to directly start looking at the logs. Okay. I'm I'm gonna assume, like, you know, Prometheus does ship really basic UI out of the box. Does Loki do anything like that, or does it really rely on Grafana? Okay. It does it does it does expose some sort of UI, but nothing really nothing really useful for us here. It's more from an operator perspective. So it's better that we look at Grafana. Grafana is more the UI for this. All right.
20:13 Is it going to be admin, admin? Or am I going to have to find the secret in the cluster? I think it is admin. Oh, it's not. Yeah. Alright. Let's export my kube config. Let's get secret. I I think I think there is one already. I'm wondering what it is. It's not so you tried admin admin. I did. Yeah. There is a there is a Loki Grafana secret here. I'm gonna assume it's there. What I'll do is I'll just pop up a follow-up question which you can tackle while I do the boarding bit for use case.
20:47 I get a bunch of syslogs from different hosts, put them into Loki, use Grafana to view and expect. I think that's it. Yes. I think that's what we're we're hopefully just about to do. Sorry. I answered your question. Yeah. No. No. No. You're you're right. I think the question is really towards Syslog, which is less Kubernetes. But, yeah, you can do that. The the the Pontail supports Syslog receiver. So you can stop Pontail. It will run as a as a Syslog server. You can send the log to Promptel directly from all your different devices that you
21:20 have and it will ship them to to Loki. Alright. I'm not gonna decode the username. I'm just gonna hope that's the basic before hash for admin. Yeah. Maybe not. Oh, no. That's just copied them when I highlighted it. Silly me. There we go. Nice. Yeah. Cool. Although otherwise, we could have just it and changed the password. No. No. No. No. We do. That's the that's the installable way. So it looks like we don't have any starred dashboards at least, but has it created And it No. But we we do have a no. There's no dashboard when you start.
21:45 Introduction to LogQL
22:03 But there is a there's a data source, I think. If you look at it's in yeah. This one, data sources. Yeah. Yeah. We can see already Loki and Prometheus are connected. Yeah. We'll try. Yeah. Okay. So we do have them connected. That's great. I guess in theory, we can jump straight into explore and begin to see what we have available to us. Yeah. So you need to select a data source at the top, I believe. Yeah. Hi. Yeah. So my first question then is how do we interact with Loki? I'm assuming it's not used in PromQL. I'm
22:25 Introduction to LogQL and Grafana UI
22:47 assuming there's a Loki query language. Do you want to walk us through this? Yeah. So we call it LogQL, Log Query Language. And so there's a documentation on Grafana that is very extensive on on everything that you can do with LogQL. But the idea is is really inspired by Prometheus again. So the label selector to select a metric, but for us, there's no metrics. So it's just this label set selector and the label matches will be the same. So you can, you know, choose one of them, and it will write the query for you. So let's let's
23:22 go to app and select one. Will we start with the meta query of app Loki? Yeah. Let's let's start with that. Yeah. Oh, it it kinda does look like PromQL, at least the label selector syntax. Right? Yeah. We're on a old version of Grafana. So it needs to it needs to you need to manually set metric or logs at the top, as you can see. There's a bit a switch button. Yeah. If you click on logs. Yeah. You can rerun the query now. Alright. Yeah. Should we should we try to update it before going further, maybe? Do you think
23:59 that's You wanna upgrade Grafana? Yeah. Sure. Let's do it. Yeah. So it's just a default format called Loki Grafana. And then she just wanna pop the image to the latest. Right? Yeah. That's it. Yeah. Yeah. Let's do that. Good. Alright. So do you know the version or should I go to Docker Hub? I was about to look at Docker Hub. What's the latest one? R Grafana. 7.5, I think. Yeah. Yeah. Let's go with it. Even if it's an experimental one, it's gonna be better. It's gonna be better. This is like a YOGO version that we're
24:33 looking at right now. Alright. Let's see what was updated recently. Let's let's see. Should we go nightly? Nightly. Whiskey. 755. Is a good one. Yeah. Yeah. Let's go with this. I believe Grafana eight currently in progress. Right? Is is that Sorry? Is Grafana eight being worked on at the moment? Yep. Yeah. Because I'm pretty sure I've seen something on Twitter recently about some big changes to like the the I think all the graphing panels are being redone and and stuff like that. Yeah. Yeah. The the graph file. Yeah. Every every major version is once a year.
25:09 Nice. So let's just see if just initializing. Let's assume the port forward is gonna. Yeah. Think the password is gonna be on the same too. You think? Oh, come on. Yeah. You know, don't forget I work on Loki. I'm I'm good with Grafana, but I'm not an expert on Grafana. Great. Okay. I'll cut you some slack then. Okay. That port forward. Maybe it's just not ready yet. Yeah. It wasn't there. Okay. Pods. Yeah. Looks better now. Yep. Should've saved it. Should've saved the password. Alright. Base sixty four d. There we go. Alright. Password's the same. We're back in.
26:14 Nice. We're on the Loki stores, and we no longer have the logs and metrics. Does that mean it's just working out? Yep. That that this is all great. This is gonna be way much easier for us to write queries and and play with this. Alright. Awesome. So, what do we have here? Like, this is I mean, I'm trying guess what we've got and I think we kind of briefly covered it, but we're using LogQL. We're looking for all of our container logs from Kubernetes where there was a label that existed called app, where the value is locating the logs
26:46 of ourselves. What we have here appears to be some sort of times very sharp to show the occurrence of logs over time and then we is this just raw logs that we have below? That's yeah. That's the whole logs. You I think you have a a version of Kubernetes that is using Creo logs. So you can see, like, the SDRF. This is the Creo format. And we can we can configure Promptel to get rid of that if we want because that's gonna be a bit difficult to pass after if we need to pass it. But, yeah, that's that's the whole log, actually,
27:25 from from the Docker daemon of each node. Okay. Yeah. We can see the we can see the the labels here. They're they're looking good so far. So this is the this top right here is just the labels from the Kubernetes resource. And then the detected fields, is this analyzing the log line itself and trying to work out what exists? Mhmm. Yeah. That's directly from Grafana itself. It's not from Loki. So Grafana, when it's showing those line, it tried to detect some sort of fields and and does some analysis on it. Alright. Nice. Same goes for the the color. You see
28:00 that the the color, it's all green so far. It's because it hasn't found any errors. So Grafana will try automatically to spot the errors in red for you. Okay. Nice. Alright. Looks like we have a couple of questions that I'll drop up just now. So Mozz is asking, does Loki support other log shipping tools like Fluent Bit, Fluent D, File Beats, or is it exclusive to Promptail? We have kind of answered that, but I'll let you I'll let you go for it again. Yeah. We we support all of them, the except Filebit, because Filebit doesn't really have a
28:34 way to plug in an in an an output clients. But we do have a lockstash, so you can do file bit to lockstash to Loki if you want. But, yeah, we support FlinBits in the I think we also support vector, which is in REST. We like, we have a docker driver also. So there's, like there's no reason to to not send the data to Loki. Like, we have we have all of them. There's a a follow-up comment as well from Frank who's actually just suggesting, hey. Loki has a REST API. So, really, you could use anything to send the
29:08 logs. Yeah. Which is cool. Alright. One more question and then we'll we'll get back to our demo. Ad so I was saying they're looking to adopt Loki, they want to adopt Loki, but they're curious to put handling high throughput or high scale. An example I've got there is roughly seven terabytes per day. Yeah. Is within the realm of Loki? Is is that good numbers, bad numbers? What's your thoughts? Yeah. It is. It is in the realm of Loki. It's difficult for me to think about this per day because I'm usually thinking about this per minute.
29:43 But it it would there there won't be an issue for ingesting that amount of data. It's gonna be actually very very easy. Now if you want to query over this huge amount of data, you may have to go into the distributed setup. But I will start always with starting with a small Loki instance, see how it goes. And if you need to scale up, then at that time, start to look at the more difficult scenario. Yeah. I think that's great advice for all software. Start with easy mode and when the the car starts to shake at high speed,
30:15 maybe do some upgrades. Okay. So this was cool. We created some logs. What do you wanna what what should we try and do next with this then? So there's multiple option that we could do. I think we need to fix this logline format here. Because you know that this F and STDR is really about the, and it doesn't really help us. So we can try to fix this. It's we need to look at the configuration of to do that. And then after, I guess, we can maybe show how the dashboarding works with Loki. Yeah. That would be cool. Yeah.
30:20 Grafana's Log Browser
31:01 So we need to look at the m chart, how we can change the configuration. It's very easy. We just need to actually add a single line. But I I'm not sure we can do it without creating a value file. So let me Oh, we can just modify the config map in lane, though. Right? I don't need to redeploy this with Helm anymore, so I'm quite happy just to modify the config map in the cluster. Yeah. Yeah. That sounds good. So let's go down. I'm looking for pipeline stages, which basically yep. That's it. So we're we're set up
31:34 for Docker. That's not what we have here. We have container. So, basically, yeah, we have yeah. Exactly. So we need to change. And it's CRI. You just need to change that to CRI. Yeah. And that should do it. And maybe that's the case also if you try this at home. I know that Kubernetes, the latest version, is going to our CI. Before, it was Docker format. And the Docker format is kind of like a JSON log. So you can quickly identify which one you have. If you have the one we have today, like a STDR,
32:05 it means it's a CI. If you have a JSON and you are not logging in JSON, it's most likely because you are using the Docker format. Alright. Well, I've triggered a rollout of that daemon set. Let's just give that, Hopefully, not too long. I guess maybe about a minute for it to to run through them all. Yeah. It should be no. It should be quick. Nice nice Cube Cattola skills that you have. Yeah. I like to learn things the hard way, so live debugging is getting easier for me these days. Okay. Yeah. I can see that. We have
32:43 Exploring Logs with Log Browser and Sock Shop Example
32:45 another question. So let's answer this question. Hopefully, the the rollout has has done its job and we'll do some dashboarding and take it hopefully, we can take into log QL bit more and and see. Yeah. And of course, like, well, I'm sure we'll we'll get to this naturally, but how do we turn on index and for specific fields and and the process of doing that? Anyway, question. Yep. So is asking, okay, there's fluidity, fluid bit, telegraph, Loki. Can you briefly position those components which are overlapping more or less? Second question. Well, let's start with the first. So fluent
33:19 d, fluent bit, telegraph, Loki, I think you're gonna think they're all in the same space. You wanna elaborate on that at all? Yeah. I think they are overlapping, and it's it's a bit like free and d. I guess, you know, it's in Ruby. So the the the the people that created free and d realized, oh, maybe we need to move away from Ruby and and write a a c plus plus client. So that's how, I guess, free and bit came to life. Telegraph, I don't think Telegraph has a has a low key output. And I don't think that's the case. I
33:52 think it can only only send to Influx from what I know. Telegraph can write to Influx Elasticsearch, HTTP endpoints, and gRPC. It's a personal bunch of things. I don't think there is a native Loki output Yeah. Yet. But you could probably do it with the HTTP output, I would have thought. I'll I'll hack on that one day. Yeah. So, yeah, definitely. I mean, Loki is really the database. Three and d, three and bit telegraph are more agent, right, for collecting data. That's that's the biggest difference. So Loki doesn't really overlap all of those. You just need someone to send the logs
34:30 to to to to itself. Alright. And then the second part of that question was with regards to the recent license change on the Grafana products. Is Loki a part of that? I guess, is Loki now a GPL? Yeah. That's a good question. Yeah. So I don't remember. I think it was last week this change happened, which was before we we talked together, David. And, yeah, not everything is AGPL in in in Loki. Mostly everything that is clients, so Pontel, everything that the user, you know, will use to send data, but also to process the logline itself is not AGPL. It's
35:13 still Apache two. So you can all you know, you can you can you can use that in your open source project if you need to without having to license AGPL, your own project. Now for most people, they they usually don't integrate Loki itself, but more the client, so it shouldn't really affect anyone. Alright. Nice. Thanks for clearing that up. Okay. We have now rotated our Promptail. We have switched the pipeline stage from Docker to container runtime interface. Yeah. It's running, so that's a good sign. Well, yeah, we didn't break it. That's great. So let's do the last five minutes. This
35:52 is already refreshing, and we have much cleaner log lanes sitting here now. Right? Yes. This is what you're working. Yeah. That's what I was expecting. This is exactly, like, what what you would expect from your application, nothing else from the infrastructure behind. So that's much better. Alright. We got confirmation from Stanislav there that Telegraph does now have a Loki output. So that's great. Awesome. Yeah. I didn't know about this. Nice. I worked for Influx for two years, and I didn't know about it. So I wouldn't judge you for missing it. Alright. Yeah. I mean, we can play with
36:26 the log browser. The log browser is a new feature. I really like it. So you can click on that and see and see how that goes. Okay. So what do you want me to click on? Sorry. Next to the next to the query, there's a there's a button named log browser with a little shovel. Yeah. We have a shovel? Yeah. No. Yeah. It's on the left. Oh, right. Got you. Got you. Yeah. Yeah, this one. Yeah. So this if you're a bit scared of LokiL at first, this is a nice way to get started. So at the top,
37:04 see all the other label names. And also, that's a good way to see if you're wasting or using things that you shouldn't be using. But you can click on, for instance, on job one. The job the job is an interesting one. And once you do that, you see all the all the the values that exist for this one. And that's kind of a nice way to browse your data without being an expert in or knowing how to use that language. So yeah, you can select one that you want, maybe Grafana, Loki Grafana if you want
37:46 the default one. So job is basically a namespace plus contained name. That's what it is. Okay. And then Yeah. So you can, yeah, show logs. And there's no log for that one. Or maybe not no log for yeah. Last hour. Yeah. There we are. So if you if you're running I don't know if we're running currently a deployment that are that has more than multiple the more than one pod. Do you do we have that? I don't I'm not sure. Let's have a look. Let's see what we've got in the stock shop. We can always
38:27 scale one of these up. Oh, everything is one. Yeah. Let's just modify one. So let's get this a little bit more interesting. We're gonna do edit deployment. Should modify orders. We check the log first to make sure they output log? Yeah. Yeah. I mean, let's make sure there is log. But yeah. Yeah. Whatever logs there is. Yeah. That's good. Yeah. Let's go with this. Just wanna show, you know, that with Loki, you can you can find logs for a single pod if you need to using labels. Order replicas. Yeah. Sketch. There we go. Oh, yes. Six.
39:12 It's a big cluster. We might as well have a problem with it. Sure. Sure. Alright. So this was our orders sock shop. So I'm gonna try and use the log browser. And what is the Yep. Turn off job. Oh, I really should have checked the labels, shouldn't I? Maybe order. Maybe it's name order. No. Deploy order. Let's see. What labels do we have? Name orders. Alright. The name orders. And we have a few options here, so why don't we talk about that? So we already clicked on show logs. It showed us all the logs from those pods.
39:54 What are the other two options here? So show log rate will, I believe, create a metric query out of the selector to show the log rate of that stream. So we we call it stream set of log from one or more different pod. And this will just show the rate of it. And validate is just basically trying to see if the query that you craft is actually valid because you can change it manually. Yeah, it's valid. Yeah, that's good. Okay, let's see the logs. And, yep, these are the logs from that process. Yep. So think I've checked the Java one,
40:38 unfortunately. Sorry about that. No. That's okay. No. That's okay. We're not gonna pass it too much. What we could do is look a bit about the labels, if you can see if they are from different pods. So if you expand a couple of lines, you should be able to see that the pod is different from time to time. Yeah. This is this one. So would we be able to, like because this like, with LogQL, could I actually group by the pod and see how many different pods there are? Yeah. We can do that. Let's do that.
41:20 Aggregations with LogQL
41:20 So I'm gonna help you to write this down. We're gonna write at the beginning. Alright. Actually, we're gonna do a wait. Do rates and then open parenthesis. Yeah. So that's exactly like Punkyard. You you should feel so, yeah, you have the selector the range selector here. So it's brackets. Square square bracket. And, yeah, select interval. Interval will automatically the first one. Yeah. Automatically select the interval that we are using on the range currently. Okay. And you can run that. If there's not too many label, it should it should go fine. Let's run that to see.
42:04 I can't hit return. Yeah. You can hit the the blue button at the top. I don't remember what's the key. Yeah. Yeah. It's probably commanded or something, isn't it? Yeah. Yeah. So we need to I think the interval was maybe just too big here. The yeah. The top the the the time shift. If you look at the top next to clear all yeah. Yeah. Click on this button next to the the loop. Oh, yep. No. It's more on the left, not the clear hole. Not this one. Yeah. Left again. Oh, yeah. Yeah. That one. Yeah. Yeah. Let's change
42:42 it to maybe five minutes or fifteen minutes. Yeah. And, yeah, we we can so it shows too many label right now. So if you know Prometheus, you can do a sum by to aggregate by pod. I think it's pod. Yeah. We can do a sum by pod. You can wrap everything by with a sum by pod. Sum and then yeah. No. So there's no there's a space between yeah. There's a space between sum and buy. Yeah. And then open parenthesis right after the yeah. Pod, close the parenthesis, and then you wrap everything into parenthesis at
43:23 the end. Yeah. Is that right? So you need to wrap it again. Yeah. You need to wrap again the rate into parenthesis one more time. That's how yeah. Yeah. So that's going to send by pod this time. So it's going to remove all the label dimension and only keep the pod. Ah, there we go. Nice. Yeah. So this pod doesn't seem to log a lot just at the beginning when it's tough. Yeah. I think it's the pod's all started up. It's about a little bit of log. I mean, we're not browsing to the sock shop. We're not adding
43:57 things to cars and trying to cause more load data. We we could definitely do that if we want, but I think we we've seen what we wanted to see here. And we've seen a burst of calls. Right. Yeah. We you know, it's nice. I mean, I I don't think I understand LogQL in GridDef or anything, but I like the familiarity with PromQL. It's not too dissimilar. So I think I could probably work my way through a few examples there. So that's pretty cool. Yeah. I think that's the idea of why LokiL is heavily inspired by PromQL
44:26 is to make it simple for people that are already comfortable with PromQL to learn this new language. And if there's something that I can add is if you scroll up to the query, is in Loki, the only difference between Loki and PromptQL is the log queries. So this is a metric query because it output a metric query. So all the metric queries are very exactly the same as in PromptQL. The log queries where you can search world RegEx world or grep world, those use Pipe. And those are more new to the space. Okay. So could we
45:00 Searching with LogQL
45:12 search for default lifecycle processor? Yeah. I think we could we could yeah. Let's do that. So you need to let let's add another query. Keep that query here and create a new one. There's a button, add query. Yeah. And then yeah. So you can do a name. So open exactly. Yeah. Write the same selector. And then after, at the end, when you want to look for a world, it is a pipe equal. If you want to do a search pipe equal and then space, and then, yeah, you put the world that you want to find.
45:47 So this is case sensitive? Yep. I think that's fine. Yeah. No. It's gonna yeah. That should be that should be fine. So if you run that, it will run both query. And it hasn't fine, I think. We may have fallen out of the five minute window. I'm not sure. I'm not oh, yeah. You're right. Yeah. Yeah. That's the case. Yeah. Yeah. It's been over five minutes since we started since we scaled that up, so I was kind of watching for it. Yeah. So we found four line that contained that one across all the pods. Right? And
46:23 that's that's that's kind of like a. So there's so there's multiple option. Here, we do a match of the world. But we can do a regex, which is instead of using pipe equal, it's pipe tilde. And then you can write regex. So obviously, that's a valid regex, what you have here, too. But you could write yeah. You can show me your Array two skill. We'll keep it simple, right? Yeah. Exactly. Good call. But yeah, you can write this is how you and you can chain them. So you could do it contains the default, but you can chain another one
47:03 at the end. So if you go at the end and you go another pipe equal, you can have another one. Yeah. You can chain multiple of Default. So the both clause needs to be fulfilled. Sorry. Can you say that last bit again? Yeah. Both both both of those clause need to be fulfilled. Yeah. That's gonna be fine. Yeah. There we go. Yeah. I mean, I don't have any Rawkode logs, but it did filter on default lifecycle, which is what I wanted. Just throwing in random bits of regex just to, you know, just to check that it
47:40 works. I guess Yeah. So you can chain as much as you want. And then after, there's the negative one. So if you need to, you can instead of pipe, you can do exclamation mark. And that's gonna do the negative one. So everything that doesn't contain. Alright. Yep. I mean, I should probably just return nothing. Would've thought. That Oh, no. There's other defaults that are in life cycle. Okay. That actually worked then. Cool. Nice. Yep. And the estimation training thing. You know, it feels like a data transformation. You know, I've got all of my logs. I wanna do a filter. I
48:15 wanna do a filter. I wanna do a filter. And I wanna get something at the end. And it it's, again, intuitive and, you know, similar to some programming languages that I've worked with as well. So I think that. Yeah. The idea is it should feel like a CLI a bit. So you're piping and processing from left to right data. That's the idea. So that's the search. Search are so that's the most powerful way to search data. If you look at your first query at the top, you can insert the search in between the square brackets and the label matcher
48:52 to count the rates of logs, but for only a specific word. So is that just this bit here? You can copy everything and replace the label match at the top here. Only the yeah, To this. Yeah. Replace this. Yeah. And then run that. Nice. Right. So, yeah. It's I don't know if it's there's not enough data, I think, to show. Maybe try to Yeah. There might not be enough data for the the rate to show. But The rate to show. Yeah. But the the apparently, there's one point somewhere. I'm not sure where it is because it shows like a zero
49:38 to two. Yeah. No idea. But try to to to, like, do a search that hits a bit more without the the second player. Let's take off the oh, oh, you can switch also to another container. Maybe look here. Yeah. Here we go. So it's not the most most nice graph that I've seen. Know? Okay. So we could use not just a label select or an metric queries, but a a fill log query to do the filtering and then perform aggregations or metrics on top of those log data, which is very nice and neat. Yeah. Yeah. That's correct. So you can do search.
50:18 And once you have your search so, for instance, you can look at, you know, do I have an error in the last six hour? And if you find an error, you can try to look at, was this error there yesterday too? And you can start to do a rate and look at, you know, since when this error is happening, how often it's happening. So you can do those kind of operation. And so to remember everything that is inside parentheses, it's the selector of the stream of the the the actual log. And everything that is a function
50:49 will be used to extract metric, so like in Prometheus. Piping goes with log, and then function goes with metric. Okay, cool. You happy to take a couple more questions from the audience just now before we move on? Yep. Okay. So we got a question here from Andres. How does Loki compare to Graylog or Logstash? Yeah. So Logstash, it doesn't really compare to because Logstash is an agent. But if we look at Pontail and Logstash, I think Pontail is in Go. And as I was saying at the beginning, the service discovery to find the labels is very much the same
51:03 Building a Grafana Dashboard with Metrics and Logs
51:33 as Prometheus. So that's the big difference. Logstash is a is a bit more a bit more focused on working on your logs and modifying them or aggregating and transforming the logs. Promptile does that a bit, but that's not the The the that's why that's not why we created. It's more like to ship logs. And gray logs, I mean, I've I never really used gray log, but I know exactly what it is. And it's the same idea. Loki and and gray logs are of the same purpose. You can send logs to to to Graylog and aggregate.
52:11 So I think the biggest difference is that Loki is inspired by Prometheus. So if you're already running Prometheus, it makes your experience a bit more easier. And it's all integrated in Grafana. And I don't think Graylog is put in Grafana. So what do you you know, let's just assume I'm an operator for a production Kubernetes cluster. We have all this log data and I'm setting down and I have to make the decision. Do I install Loki to my cluster or Elasticsearch or both? Like, how do people evaluate and make that decision? Yeah. I think if it's if it's so
52:45 if it was me, and I'm also, you know, doing operation in my in my in my job, and if it's for logs, I will go for Loki. I will always go for Loki with logs because that's what it has been created for. After, if I'm building a shop and I know that some of my customer will need to search for a given world to find a specific product, I will use Elasticsearch for that to store the information of my store. But you can quickly realize the difference between the two is one of them is going
53:19 to probably receive a lot of traffic. The other one should only receive, I don't know, a couple of thousand of product that you have. And that should make it a bit more easy to easier to scale your Elastic cluster compared to Loki. So it really depends on the use case. That's what I want to say. Elastic is very good for indexing data and your items using LUCEN queries. Loki is really good at logs. That's what it does at best. Yeah. So let's kinda talk about the the difference there as well. Like, Elasticsearch indexes everything, I believe. It does full text search and
54:00 Dashboards and Panels with Loki
54:00 has indices for it. Everything every document that you throw into it is is is really index. Loki, you have to be a lot more explicit about what we want to index. It's not am am I right in saying that Loki can index stuff, I just have to tell it which fields I I care about. Is that correct? Yeah. That's correct. So by default, like you like you've seen when we install it with Elm, we choose a couple of a couple of labels that we think are good out of your own label from Kubernetes. But you can configure that. You can add
54:29 more. You can extract directly from the log line, the label, like the label. If you want to have the label, you can extract a bit more. You can do that. But by default, usually, for most of the people, it should be fine, you know, what we have configured here. Okay. We have another question, which I think leads in nicely to what we want to show next, which is kind of maybe dashboarding and such. So Frank has asked, is it possible when a customer found a dashboard with a logs panel for a filtered set of Loki logs to activate this expand
54:58 functionality like an explorer view? Yeah. I think it is. So I think if the question is, can we have this query here inside a dashboard, the answer the the answer is yes. We can have that. Okay. Let's let's take a look at the dashboard and stuff then. So we build a dashboard with a a mix of metrics and log data? Just a really simple Yeah. Yeah. Let's do a let's do that. Alright. So you want me just to click create dashboard? Yep. There we go. And then we wanna add panel icon. Yeah. Yeah. Let's start with a metric. So look
55:45 at promoters maybe if you wanna add metrics. K. So you need to select, yeah, promoters. Metric, I think you should You can find one. I'm thinking what we're have here. Oh, we have cAdvisor running. It's good. Can look at CPU from cAdvisor. Oh, shit. That's maybe it's container. Maybe it's container. Yeah. Load average over ten seconds? Yeah. Zero. But it is a metric. So And then just apply? Yeah. The other yeah. We need to I'm not sure this was one Alright. A great Excellent. But the load average the the load yeah. That's the what I
56:46 was thinking. As yeah. CPU CPU is not a bad one, but, yeah, let's take another one. Node or we can do a Pontail, like a a Pontail total line received, something like that. There's a Pontail somewhere. I've seen it. Yeah. Because we we yep. And then what do we have? Log byte total is not bad. Log entry log read byte total. Yeah. Let's do that. So you want to write and sum all of this. So sum parentheses rates. Yeah. So if you want to buy, I think a pod will be will be there. We can
57:35 do pod, most likely. You can do some buy, though. Yeah. And then the rate at the end before yeah. Right here, and it's the entire yeah. Five minutes is good. Or one minute. I think aggregate was some Yeah. No. Put one minute. I think it's better. Yeah. Okay. Alright. Yeah. Maybe the it was working. Yeah. I broke it. Maybe it's the the the part that doesn't exist, possibly. But it it was returning data. Right? That's not a good query. If yeah. Go back and just do a sum, right, like, resolve the bipod. Remove the the bipod just to make sure that we're
58:32 not missing. Yeah. Are we still on the parameters at the top? Just call it up. I'm not showing it anymore. Yeah. I broke it. There we go. Oh, here we go. It's just leaving. Yeah. Yeah. I mean, rates rates should should give you, like, the The change over time. Yeah. Yeah. The change over time. And then there's not a lot of there's not a lot success or the rate rate. Yeah. Well Yeah. There we go. Okay. Yeah, maybe one minute was not a good idea. Maybe you need something bigger. Because if the Skype interval is too small, then that could cause a
59:22 problem. But yeah, five minutes is good. And that's in bytes. So I think in the fields next panel, you can put bytes there if you want to make it more more fun. So there's a field tab. So you're on the panel tab. Next to the panel, there's like a field. Yeah. And then in unit, you can choose I think it's data or byte. Yeah. I see. Yeah. SI. Yeah. Yeah. So that's the rate of logs that we receive over time, which is a good burst at the beginning. And then after, it's a bit less. But yeah, you can look
1:00:01 at the last hour, maybe, instead of six hours. So it's going to look a bit better. Yeah, that makes more sense. There we go. Alright. So that's that's a metric from point is metric metric panel. Now what we can do is add another one, and let's let's put the logs of Promptail next to it. So panel, if you go so if you click on Loki, and then on visualization, on the far right visualization, this yeah. You can choose a log panel somewhere. Logs. Yep. Alright. And now let's do name Pontail, if you have it. You should
1:00:46 have it. No. So I think it's because we don't have the name. So it's app. App. Yeah. You should use consistent labeling name. Yeah. There's app. There's Nothing like us. There's case app. It's just so variable. Yeah. Alright. And then I'll just need to So let's try to see if we can find something a bit better, like find the errors or try to to pipe into, like, tail. Yeah. So pipe equal tail. Then look for the word tail. So just to show that we can do a search here. So it's, I think, tail is, yeah,
1:01:33 not a capital t. Yeah. You can do that, but it's yeah. Tilde. Yeah. Nice. And you can save that. Yeah. And you can usually, I like to make my my lock panel a bit bigger. So use a use a single hole and make it use the the the whole row. It's much better. Nice. So yeah, that's the beginning. But you can build very interesting dashboard. Oh, nice. I filtered the when I sorry, I did the zoom and the metrics. Then I actually zoomed in and filtered the logs as well. Yeah. So you can see the logs that
1:02:22 if there were any logs that contain tail at this moment in time, which is kind of nice for errors, right? I don't think we have any errors. But maybe we can find some. But it's kind of nice to see when you have an error, can you correlate that with a metric and find the metric where the error was happening? So being able to mix the two is kind of nice. It's being able to mix two different signals. Nice. I like that. Yeah. And you can jump directly to explore. So when you have a dashboard like this, when you
1:02:53 click on the on the panel at the top, the panel title, then you can go directly on explore from that query. You can do explore here. And it goes to explore, and you can start exploring. Yeah. Save it. That's our work. I need to ship this to prod layer. So There you go. Yeah. And I get my And and you keep yeah. And you keep the query, and you can maybe improve the query and, you know, try to find a bit more information for what you're looking for. I'm amazed to see that those logs are the
1:03:10 LogQL Parsing, Extraction, and Transformations
1:03:26 prompt tail one are still in the wrong format. I think this was we changed the configuration at 45. Okay. One forty five. It's time Can we We could restart prompt if you want. No. That'll be it. Okay. Can we look at the can we look at Loki Loki logs for instance, maybe? Of course, we can. Yeah. Upload. Yeah. And then remove the remove this. Yeah. Now you're getting good at Okay. Alright. So, yeah, I wanted to show you a bit more interesting queries that we can do. And because I know a lot of Loki logs,
1:04:00 Parsing Logs with LogQL
1:04:05 obviously, I expect developers to know a bit more about what they are logging. So that makes it more interesting when you want to play with your logs. So I know that Loki is kind of like logging every time you make a query. It's logging the query itself. And I want to show you, let's try to show only that. Imagine you have a database. Every time someone does a query, you want to create a dashboard that shows all the queries that have been made by the user. So let's use the equal here. Let's use the equal instead of the yeah, equal. And then
1:04:40 use metric. Go, and then there's a comma. You can see in the first line. Yeah, metric. Go. There's asset metric. Metrics. That makes sense. Yeah. And then run that. And we're gonna be able to find oh, yeah. And now we can see only the logline that are showing metrics. What's nice here is what we can do is we can start using and pass that logline. So we haven't done that yet, but let's do that. So this logline is in log format. That's what we call log format. So it's a key value pair. It's a key equal value,
1:05:21 and then space, another key equal value. And it's very human readable as opposed to JSON. And in the query, let's look at currently the let's add a pipe and then log format. So L O G yeah, it's going to suggest it. Yeah, this one. Right, so hit Enter. Now, if you look at the labels of any of those logline, you're going to see that something has changed. And there's way more labels. There, there are. And that's basically all the key value pair of the logline itself. They have been extracted, and you can now use them as labels.
1:06:07 So that means you can aggregate. You can use them to search, filter. And and we can even transform some of them into metrics. So you can see there's a status here. Yep. 200. So you could technically do a rate per status now. If you wrap everything with a rate a a sum by rate. So we do sum by stages. And then you need the you need the, yeah, you need the bracket at the end right after the yeah. Square bracket right after the end of the log queries. It's inside. Yeah. Exactly. Yeah. Here we go. So we can see by
1:06:58 status now. Alright. So status is not labeled. This will fail. And theory, me paste this back. We we should be able to see some failed ones there? No? Yeah. Yeah. I mean, I don't know if we show them as a status to I think the 400, we don't we just this is a code that doesn't get triggered by 400, so that's why you don't see it. You don't see it there. It will actually need to crash to see it. But you can add another query and and look at the query dot go. Yeah. Click on other query, and then copy
1:07:42 this selector with, yeah, everything except and you can look at if you can see now the font. I don't think you will see it. Remove the standby and the rate to see the logs. Oh, it's got the logs. Right. Okay. Good. Yeah. Let's let's let's look at the logs, see if all the bad queries that you've made will show up. Yeah. I like to have always two query when I'm crafting queries. One to show the logs so I can see what I'm working on, and one which is the metric one that I'm crafting. Can you see? No. You see it doesn't
1:08:13 actually show. However, there is one label that is interesting. As you can see the type, query type. There's metric and there's probably filter. So if you change the sum by status, you change it by query type, you're going to see different type of queries instead. Does it show you the number of results for a query? No? No. No. Not no. But it shows you all those all those things. So at the top, yeah, I've changed the status, send by query type query underscore type. Yeah. And now you can see that there is different Metric different type of queries. Limited query.
1:08:57 Yeah, limited is a search. And that's Filter is also a search. So that's yeah. So you can see the different type of query that have been made. And you can imagine if you are SRE. There's a lot of information that you have in your logs, you can aggregate now by extracting those labels. Yeah. There's a there there's there's more that we can we can do. We can look at how to use those those numbers. You see the duration here? Inside the logline, you can see that the that metric took four milliseconds. We can use those to maybe graph a
1:09:34 quantile. If you if you want, we can do that. Okay. Can we contrive something? So we have where we use the log format here, we're bringing in a whole bunch of extra labels into our each record in the stream Mhmm. Which means that we have access to the query itself. Could we contrive a situation where if we query for Rawkode and then count the currencies of that search over time and then that means we can do loads of them, stop it, loads of them, just to try and see how this works together. Because I'm curious, like, we've not
1:10:18 told it to index the query. Right? That's something that comes in from the log prompt. Yeah. Okay. And it wouldn't be a bad idea to index it because, you know, the of it could be very high. So don't do that. However, the log format, the pipeline format that you did is doing that at query time, is actually extracting the labels from the log line. It's not coming from the index. But you can still use it to run aggregation. Yeah. So if I add another query here and say this and then say where Rawkode I mean, the
1:10:53 first time I run this, we're gonna get nothing or maybe itself. I'm not sure. Nothing, I think. Yeah. It's mixing the two. Yeah. It's mixing the two. You can hide it. There's a there's a button on the yeah. You click on that and it's gonna hide it. Okay. So now I've got that one request for Rawkode. If I do it again, we should see two. Alright. Okay. So we can, like, fake the rate essentially by just Yeah. You can. Yeah. Alright. So should we try and rate the searches for Rawkode every five seconds? Yeah. And then that will give us a
1:11:28 draft. So I'm assuming if I just come in here, query Mhmm. Rawkode five seconds. Is that right? Yeah. That's correct. Five second is a is a bit low. You need to make a make a big gap because this is a range that it's gonna search for. Oh, this is the oh, okay. I thought it was how many I thought I was doing a rate over five seconds. Okay. So let's do five minutes. We should return them all. Yep. So what's that rate over? How does it determine the window? So the window is at the top, the
1:12:17 time selector that you have. So currently, you are on, what, an hour, I think? So it's going to split the hour into multiple point. And for each point, it's going to look back at five minutes. Yeah. So it's an hour. Okay. So why did five seconds not show me how many searches for Rawkode I had? Oh, it did. We were just It does. It Yeah. But you're going to miss my point is you're going miss a couple of them if you if you do just do five. You're going to see some, but you're to miss a
1:12:46 couple of them. Okay. So Because five seconds, if you don't know what the interval is between each point. So it's exactly like Prometheus, the query. So this is a query range. A query range is basically an instant query that is executed for given steps or every depending on the the interval, the total interval. So if it's a one hour, it's probably gonna do 60 step, one for each second. Looking at five seconds, yeah, you're gonna probably hit all the the points. But if you are looking sub second, you will miss a couple of data because for each point, you
1:13:23 will not look at all the point in the in the window. Okay. That makes sense. I've got one follow-up question then. So this, I completely understand. That's we've got disabled right now, so I'm gonna ignore it. But here, we're just searching the entire log line for Rawkode. Can I only search the query and I guess that would come after I do the log format? Can I then, how would I only search on the query field for Rawkode? Yeah. No. That's a that's a good good question. So all the labels that you have extracted now can be used here.
1:14:00 So you can use query equal, for instance. And that's like this is it's less fast. It's a bit slower than doing a pipe search because pipe search are really the first thing that happen. But if you do a search here, it's going to happen after the log format. So he still needs to process all the log line one by one. But it's not a pipe equal. It's pipe this time. Just pipe. And then here, you can add any labels that you want. And there's a lot of things that you can do. So let's start with equal
1:14:34 the name, yeah? Like that? Yeah. Yeah. I think you're gonna need to hide now you hide it. Yeah. Let's let's see. Let's remove the the log query. Plus, it looks like it's not having a good time. Remove this query? No. The the first query, the at the top, like, this one. Yeah. I think that's the one that's struggling. Yeah. Yep. Oh, it didn't find any. Maybe you need to look back in Let's just try Let's just make sure. Let's make sure that it's query equal. Ah, you see there's like a, yeah, Query I think it is.
1:15:35 So is there is there a special syntax here? I mean, is is this just a regular filter? No. No. Okay. No. No. It's a it's a label of we call it label filter. So you need label equal on yeah. But it's and it's the yeah. And it's the part. Yeah. That's not gonna work. You need the yeah. He needs to know if it's a string. So yeah. I know. Don't don't yeah. That's not gonna work too. I'm just gonna keep taking No. I think it should it should work there what you did at first. Like, let's try again.
1:16:08 Yeah. You need to include to quote it. Yeah. Quote it. Can you increase maybe the window? I don't know. What's the is it one hour? Fifteen minutes. Thirty minutes. Yeah, it's not coming up. So let's try duration instead. So let's try duration. And then you do below five seconds, s with s. Do we yeah. Alright. So can we see those logline that you're trying to find? Yeah. So that Because it's query Yeah. So there's one there. Yeah. Yeah. Yeah. It's because the label one, like, a is a real. It's not like a grep. Right? So the query the real query is
1:17:07 app equal Loki log format query. You see what I mean? So you need to do, like, a regex. So you can you can filter with those now. So you can do a if you want. I do this. Yep. That's going to work. It should have worked. Why is it not working? Yeah. I just Try Loki instead. Try try Loki maybe instead of yeah. Just to see if Yeah. So is the label query exist? Now I'm now I'm curious. Can you, yeah, remove everything? Look at just this. Yeah. Look at the labels. That's what? That's the Oh, yeah. Yeah. We need the
1:18:04 metrics. Yeah. Let me do equal yeah. What? Wait. Maybe the quotes. I didn't need the quotes. Right? No. Yeah. No. You need it. Yeah. Oh, yeah. Yeah. No. You needed to to say it's a string. But that was working. Right? That was saying that's just a basic query of find Rawkode in my log, I thought. What have I done? Yeah. I'm I'm I'm also impressed that it doesn't work, but it should be working. When in time Yeah. Let's just go back to explore. Like, Loki. And what we were gonna do was app equals Loki. And then let's get all the logs for
1:19:07 the last fifteen minutes. And then We can see it here. Yeah. We can see Do a log format to see the labels if we For my own sanity, just wanna walk through those things that didn't work. I don't know why they didn't work. Yeah. That's I think a friend was a little confused. Okay. That's better. Alright. Let's blame Grafana. Yeah. That's good. So so we have query here. So what we were saying was So this is a global search, but we wanna do it as the individual filter search. And you're saying I could just rejects?
1:19:42 Yes. Like so. Mhmm. But it doesn't want to. Yeah. Let's let's maybe try This is a good one. It doesn't want to. But you can do a yeah. The query the query was the just I'm I'm a if you click on the logline yeah. Click on it to see the labels. Yeah. It's the Well, the duration one worked. Let's try level info. Yeah. Let's try level info because this is gonna be a call. Yeah. Yeah. Okay. That works fine. That works. Yeah. I think there's a mistake somewhere in the query that we're we're doing. I'm gonna try
1:20:34 this. Yeah. This is yeah. Try yeah. Yeah. Okay. Something wrong with that potentially. Okay. Let's just ignore that. But and for dead work. Okay. So once we've got log format, we can then query individual labels Yeah. Then the data. Of course, you were very clear that there's a performance penalty for this because this all happens on the stream and real time can be a little CPU intensive. But that was Yeah. Really, really cool. But that yeah. But that's what Loki has been built for. Right? It has been built for you to use resources when you need it to, not when you're
1:21:11 ingesting. So when you query, we expect you to burn some CPU because you're going to scan data. You're going to scan a lot data. There's a little index. So since the index is very small, we expect you to have to need to do those scan to find what you want to find. We can rewrite the logline. So maybe we can look at this if you Yeah, sure. Let's do it. So right after, you can pipe in. There's an operation name, line format. And it's using your favorite Go Go template. Go template. Yeah. So yeah, exactly. Yeah,
1:21:33 Extracting Metrics from Logs using Unwrap
1:21:51 exactly. So let's try dot query. Yeah, Ladle, yeah, for instance. I think you need the yeah, I'm not sure. I'm Oh, yeah. Think it needs to be yeah, I think you need to yeah, exactly. All right. So you can even add a smiley if you know how to do an image con. I actually know. Oh, you know how to. Nice. It didn't work. I don't know what's my emoji. I don't know. It should be working. I use it a lot of time. Let's try But you can see the logline is is yeah. Don't know if the yeah.
1:22:36 No. Oh, well. It doesn't it doesn't want to. But we we do get there. Yeah. Sorry. On your go. Yeah. And, yeah, that that's that's pretty cool because you can use this format. If if the log line were not very sane, you can pass it, rewrite it, make it more readable. And you can use that in a dashboard again, you know, if you want to have, like, a table showing only duration or only information that you want. Yeah. That's what I was as soon as you showed me the the the line format here, and I can
1:23:07 assume what we were working here. I said, oh, we're we're now able to build, like, tabular data. So does that mean can I change the visualization on this to to be a table? Like, if I change the I don't know. I don't know if we support that now. No. At at least not in explore. But I think in the dashboard, it it works. But I'm not 100% sure. We can give it to try if you want. But it needs to be a dashboard. My emojis have broken Grafana. Broken broken Grafana. Yeah. I can see that. I'm just gonna copy this query.
1:23:39 Let's go back to our dashboard that we built. I'm sure I could have just added that to the dashboard, but my Grafana is not great. Let's do ads. Let's do row. Nope. That didn't do that. Okay. Panel. Better. We wanted to do a Loki query. We want to drop in this. We've got a line format, which needs And we did, that's the level query. Was it query status? No. It's just status. Status. Yeah. And then we'll do the query. You can even add labels that are from the index if you want to add the the app
1:24:27 or the the the container from which container it comes from. There's a you know, all the all the labels are are available. Okay. So we can we can probably just take off the Rawkode. Yeah. The Envoy is not really doing much, but let's just take it off anyway. Yeah. Not all the logline is gonna have this this query label, but that's okay. Oh, and it's actually offering to switch to a table. Oh, interesting. Oh, never seen it. Fancy. But it actually detected that we had oh, no, but it's not got the fields that I told it to have. No.
1:25:00 Metrics from Logs
1:25:13 But maybe you can change maybe you can change the yeah. I'm not an expert on that, but I think it's possible to select, like, the in the transformation, like, the labels as a field maybe. Well, we do have the logs and exactly the format that we expect. Let's try that again. Oh, this is the line. Okay. So we probably have to It's just the line. Got it. Yeah. So pretty cool. But I think I it's a nice feature feature request. I'll take this back to the GraphQL team. Nice. I like it. There's one last thing that we haven't that
1:25:55 we haven't really show about the language is extracting value, like a numerical value from the logline and use them as a metric query. That's the last most difficult type of query that we can do. But they're really cool because there's a lot of people out there that have a counter or speed or duration in their logline. And they want to maybe graph the average or things like that, or the quintile, the max, or the mean. And we can do that with Loki. All right. Do you want to walk me through it? Yeah. So you don't need this
1:26:33 line format anymore. Everything can be removed. You still need the log the line format, you don't need it, but you still need the log format because we want to use one of the fields. So what we're going to do is we're going to use the unwrap. So it's u n w so u n yeah, wrap. And then the name of the label that we want to unwrap. So unwrap means use that label as sample value. Let's use maybe duration. So it doesn't need parentheses. So yeah, to remember that is very easy. Everything about the logline,
1:27:13 it doesn't need parentheses. It's all pipe. So we need to make sure that it's only yeah. So let's do an average over time of all of this. Average underscore over time. So we need the over time, yeah, over time. And then you need yeah. But the bracket needs to be inside. And you need at the end to add a by. Let's do a by pod. Yeah, it's a by pod. No, just by. And then parentheses open and close. Grafana is disturbing us here. Just by enclosing to parentheses pod. Sorry, I missed that last bit. Yeah,
1:28:11 just add. So remove bytes All right. Okay. And add parentheses, open parentheses, and then part. Yeah, that's so there will be probably errors because duration doesn't really exist on all the logline. So there's two options. Either we can skip those, or we can filter them manually. I think skip is better. So at the end of right after duration, you can add another pipe. And there is a special key one for the errors. It's underscore underscore, error underscore underscore. And we can do equal empty string. So that means we're going to consider only a logline that doesn't have an error. Because
1:28:57 the error label is basically added every time there's an issue passing the logline. So that should be working. You need to switch that to a graph, I believe, on the visualization. Right. So it doesn't find anything. And it's because duration so this is going to be confusing. But duration is in a format. It's in GoDuration format. And so we need to tell the unwrap how to pass that. And you just need to enclose duration with duration again. So open parentheses here and add duration inside the parentheses. Yeah. Yeah, exactly. So yeah, normally you will name
1:29:44 duration. You will name your own duration. But that's the reason why. We need to tell it. If it's bytes, so there's another one, which is throughput. And you can switch if you want. You can do the first duration. You could switch it to bytes with S at the end. And then duration by throughput. Yeah. And this is going to be the average throughput per query in bytes. Okay. So we have a label selector with a log format. The unwrap is extracting one of the values from the log lanes where we're telling it which type of value it is. So we
1:30:22 try doing a duration duration and we also tell in it that throughput is abates. We're then piping through to where error equals zero just to filter out any lines that didn't have a duration and we've got the average over time by a five minute window and then we group that bipod using. Exactly. But that's a very powerful query because the throughput here is actually a value that is inside the logline. And I can aggregate all the value of the throughput that exists in my logline to see, you know, over time how it looks like, like the average.
1:31:00 So this is in bytes. But that that can be very useful when you're looking at duration if you want to do you can even do a quantile on top of this. So things about NGINX logline that outputs the duration in seconds, and you can get the average latency in seconds without having to instrument promoters, right, just with the logs. By using the quantile, I can see what are 99% of my requests returning under to see when I've got major performance problems or Yeah. Problems in general, I guess, to be fair. Okay. Yeah. Very very cool. There's
1:31:37 Conclusion and Wrap-up
1:31:39 a lot to cover. Well, look. There's Yeah. There's a lot. Yeah. But I could I could already see where it fits in to my to my stack. What I wanna be doing with it. Getting all those logs from my containers into it. The ability to work with both logs and aggregations of them into metrics, I think is is almost a superpower. I love being able to have that side by side and a graph on a dashboard and really help just increase that, you know, understanding I have of all my systems. So yeah. Yeah. Awesome. Very cool.
1:32:12 Thank you for for coming on and sharing that with us today. Yeah. I think that we did we did good. I was expecting more more issues along the way, but you did well with your community skills. Yeah. Well, you know, you rave it off all of those queries definitely kept things running smooth, so I definitely appreciate that. Although, we'll need to work out what happened with that little magic equals regex we had in our labels. Yeah. I'll open an issue for you. There you go. There's my contribution for Nice. Nice. Love it. Alright. Well Thanks a lot. We we don't
1:32:43 have any more questions, but, you know, to the people watching, thank you very much for for tuning in, and I hope you can see the power and flexibility of Loki. I hope you get it deployed to your systems. Feel free to ask any questions on the YouTube chat and the Discord or reach out to us on Twitter, and we'll do our best to help you out. Sarah, thank you for joining me again. It was great just to go through this. You have a really good talent for just guiding and explaining things as she goes. Thank you
1:33:07 for doing that. Nice. Nice day. Thank you for having me. It was very nice. I enjoyed it. Alright. Have a great day. I'll speak to you soon. Bye. Thank you. Bye.
Technologies featured
Meet the Cast
Stay ahead in cloud native
Tutorials, deep dives, and curated events. No fluff.


Comments