About this video
What You'll Learn
- Connect Grafana to a Parca server with the built-in data source plugin.
- Filter CPU profiles by executable and isolate the million dollar application.
- Use flame graphs and function filters to spot allocation hot paths.
Add the Grafana Parca data source plugin, point it at your Parca server, and debug a misbehaving app with flame graphs and function filters without leaving Grafana.
Jump to a chapter
- 0:00 Intro
- 0:10 Profiling as part of Observability
- 0:25 Overview
- 0:37 The Need for Integrated Profiling
- 1:03 Grafana for Observability
- 1:31 Integrating Parca with Grafana
- 1:47 Guide
- 1:56 Review of Existing Parca Setup
- 2:45 Setting up Parca Data Source in Grafana
- 3:55 Exploring Profiling Data in Grafana
- 5:03 Filtering Profiles by Application
- 5:45 Analyzing Profiles and Identifying Issues
- 6:22 Understanding the Grafana Profiling UI
- 6:40 Debugging with Function Filters
- 7:28 Identifying Bottlenecks in the Profile
- 8:29 The Benefit of Integrated Debugging
- 8:44 Outro
- 8:45 Conclusion and Next Steps
Full transcript
Generated from the English captions. Timestamps jump the player to that moment.
Read the full transcript
0:00 Intro
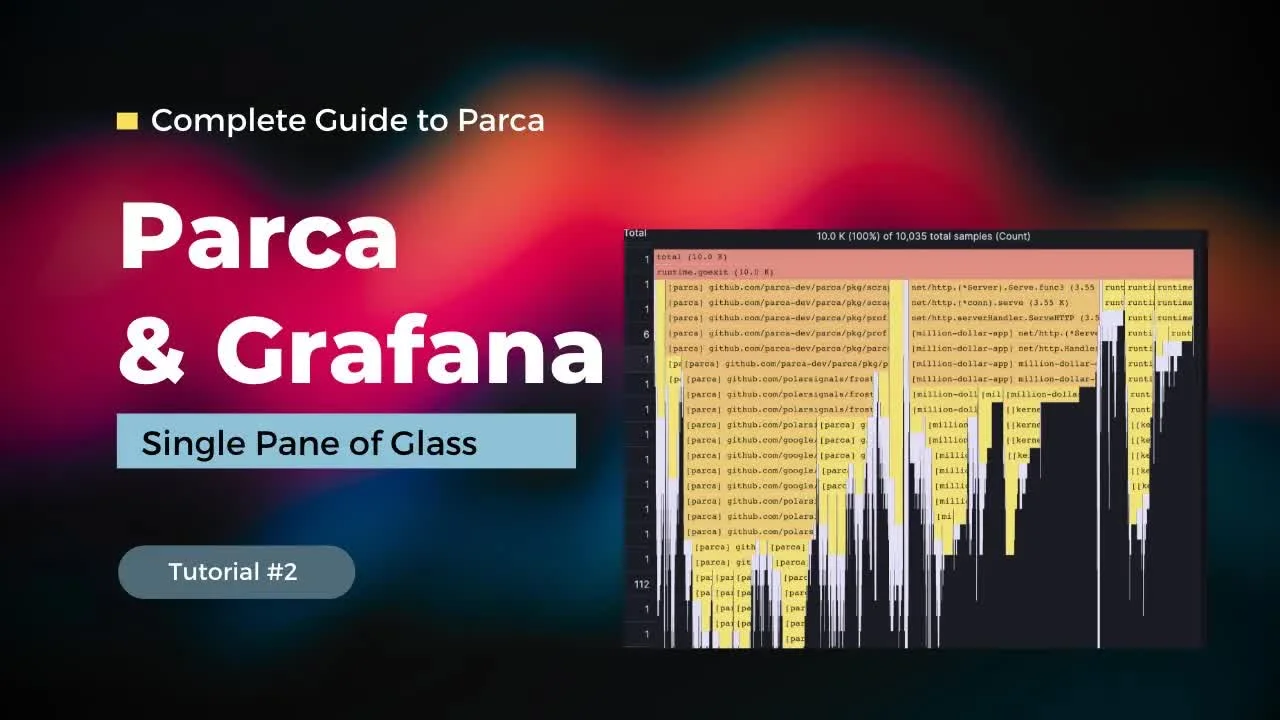
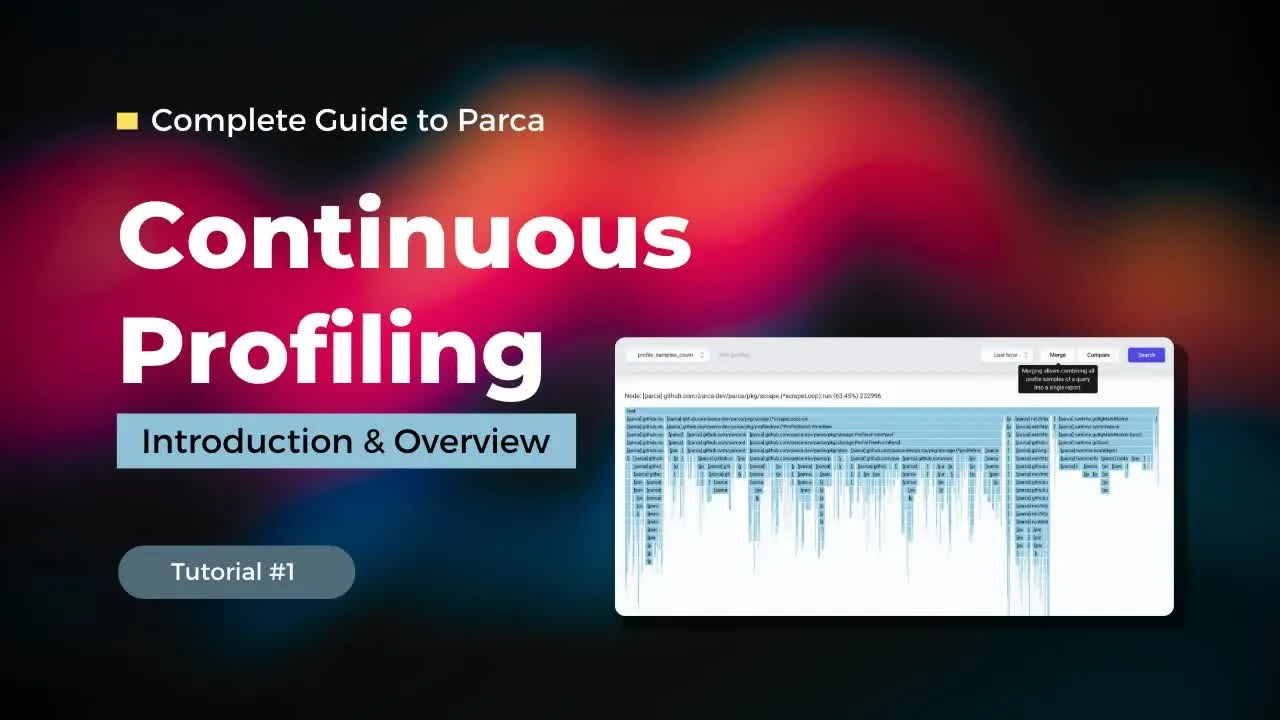
0:00 Hello, and welcome back to the Rawkode Academy. I'm your host, David Flanagan. And today, we will continue the complete guide to Parca. Before we go any further, let's set the scene. You are working on your million dollar application, and is running in production to hundreds, thousands, hundreds of thousands, or maybe even millions of users across the world. You need to understand how your application is running from metrics, logs, traces and profiles. Now, in our first video, we took a look at profiling our application with Parker using the Parker server, the Parker agent and the Parker server UI.
0:37 The Need for Integrated Profiling
0:45 However, we don't really want our profile and information to live in isolation. It becomes a key component and our observability stack. We actually need to consume this information side by side with our metrics, logs and our traces. We need a single pane of glass. Now I hate using that term. Why? Because vendors have thrown it down our faces for the last ten years trying to sell us snake oil. So their products that offer this wonderful magical experience to understand our application. But really Grafana is all you need. Grafana can speak to your metrics back end, your
1:03 Grafana for Observability
1:26 logs back end, your tracing back end and now your profiling back end. So in this video, I'm gonna show you how to take those Parca profiles, add the Grafana plug in, and how to debug your applications all without leaving Grafana. Let's take a look. Hello. And welcome back to the Rawkode Academy. I'm your host, David Flanagan. And today, we will continue the complete guide to Parca. So first, I have a virtual machine on the cloud running the Parca server. You can see here it is configured with a test agent, which has been scraping for a while now, as well as a static
1:56 Review of Existing Parca Setup
2:08 config scraping Parca itself. We have a Parca agent, which will list the different profilers. Here we have the Parca agent CPU. So we are consuming CPU samples with the Parca agent for any process discovered via as eBPF probe. We can expand the process list here, see everything that we need to see. Now of course, we'll see the Parca agent, we'll see our Grafana and we'll see our million dollar application, just like in the first video. However, we don't want to do this with the Parca UI, nor can we do it with the Parca agent UI.
2:45 Setting up Parca Data Source in Grafana
2:52 So let's jump over to Grafana. So this is a plain Grafana install. Nothing tweaked to configure or installed yet. So we're gonna go straight to data sources, where we have the big blue button to add a data source. We can add this like so and type Parca. Now what's really cool here is that Grafana themselves have worked on a core plugin to support Parca as a backend. So you don't need to go and find any third party ones to get them running. You just click go and enter your Parca URL because these are running on the same machine
3:33 that's a local host seventy seventy. Now I can hit save and test and we expect a green check telling us this data source is working. Perfect. And honestly, that's it for the config part. Go to data sources, click add, click save. Could not be easier. So let's scroll up and say, let's explore this data source. Now this is gonna function the exact same as the Parca server UI. You get to pick the profiler information that you want. Here we'll grab from the Parca agent CPU profiler because this is the one doing auto discovery on the node.
3:55 Exploring Profiling Data in Grafana
4:15 And we'll ask for CPU samples. Now, I can just say show me the last five minutes and click go. And we'll see all of our applications running on the host. If we scroll down, we'll see right at the top, we have my million dollar application. We have the Parca server, my million dollar application. Some kernel stuff, Parca. And if we scroll down a little bit more, eventually we'll get to any other application. There we go. Container d, Grafana, Docker d, Lebessey and so forth. So currently, we're viewing every single piece of profile information that we have available from the Parca agent.
5:03 Filtering Profiles by Application
5:03 So let's reset our view. Let's go back to the top. Let's filter on executable, where we get an autocomplete list of all the applications running on the host. If we want to take a look at Grafana, we can type it in and say run. If we want to take a look at the Parca agent, we can do that too. However, what we really want to see is the same application from the first video. That is our million dollar application. So let's click run. Now we have the c pro the CPU profile and information for the last five minutes. Already,
5:45 Analyzing Profiles and Identifying Issues
5:50 we can begin to see some problematic functions much like we did in the first video. But let's just jump back over to our terminal. Where we can run a curl HTTP local host, eighty eighty, I equals two and j equals one. Now this should return a response very quickly, but it's not because we have a problem. Our calculator is broken. So, let's dig in. Well, first, we have this nice little graph that show us the CPU sample fluctuation. You can switch it to a bar, points, stack lines, stack bars, and so forth. All the Grafana features that you're probably familiar with
6:22 Understanding the Grafana Profiling UI
6:37 having used it for such a long time. We then have the profile specific information. We can switch to just the top table, just the flame graph, or both side by side. From the Stairs box, we can filter by functions. If we have a rough idea of what we think is wrong, then we can establish that by saying, show me just the addition function. This grays out everything on the right and filters down to the function here. From here, we can focus. And we can see that for the many many samples of the addition function, most
6:40 Debugging with Function Filters
7:16 of the time is consumed with this fed function and then mem move as well as heap pointers and grow slice. So clearly, something weird is happening within addition dependency or Fibonacci function. There's some serious memory allocation or memory movement happening. And then after that, everything kind of shrinks down showing us that they're not actually consuming that much of our CPU cycle. So let's reset the view and without the search this time, we'll do the exact same thing. We can see here that our total allocation is up here. We have the serve function, which of course is gonna take up more
7:28 Identifying Bottlenecks in the Profile
7:57 the majority of the time because it is an HTTP server. And this is true for all of these serve HTTP things all the way down. Then we have some standard stuff happening over here that doesn't really raise any red flags, but of course, addition Feb setting here right before the yellow breakdowns, the shrinking of the icicles down the graph. Again, highlight that we really need to focus our time here. Specifically on this fib and actually function. That's when you would go to your code. You would scrutinize every lane, look for bugs, run performance tests against it,
8:29 The Benefit of Integrated Debugging
8:36 write new test cases, whatever you need to do to establish what is happening and all without leaving Grafana. So that's getting started with Parca and the Grafana plugin. Like I said, this is a short and sweet video. It's very easy to get started. You barely have to do anything and you have your profile and information with the rest of your observability stack. So go have some fun. Profile applications with Parca today. Add the Parca plugin to your Grafana. When you see bad things happening from metrics, logs and traces, correlate that with profiling information from Parca.
8:45 Conclusion and Next Steps
9:16 Debugging has never been so much fun. Till the next video. We'll see you soon.
Technologies featured
Stay ahead in cloud native
Tutorials, deep dives, and curated events. No fluff.


Comments