Kubernetes 1.34, scheduled for release on August 27, 2025, will bring a significant enhancement to cluster observability. KEP-2831 introduces distributed tracing directly into the kubelet—Kubernetes’ node-level workhorse that manages pods, pulls images, and orchestrates container lifecycles.
While Kubernetes has provided structured JSON logs, metrics, and events for debugging node-level issues, correlating these signals to understand complex failure scenarios has remained time-consuming. When pods get stuck in Pending or ContainerCreating status, you might spend significant time piecing together logs and events to understand the sequence and timing of operations.
KEP-2831 changes this by adding OpenTelemetry-based distributed tracing to the kubelet. This means you can now visualize the entire lifecycle of pod operations, see exact timings for each step, and quickly identify bottlenecks—all while correlating these traces with your existing application-level observability.
What Kubelet Tracing Actually Does (And Why You Should Care)
Think about the last time you had a pod stuck in Pending or ContainerCreating status. While kubectl describe and kubelet logs could tell you what happened, understanding the why often required correlating timestamps across multiple log entries and events.
With KEP-2831’s distributed tracing, you get structured visibility into:
- Pod lifecycle operations: From scheduling to running state with precise timing
- Container runtime interactions: Image pulls, container creation, and startup sequences with duration metrics
- Volume operations: Mount/unmount operations and storage interactions with latency data
- Resource management: CPU, memory, and storage allocation processes with performance insights
The key advantage is seeing these operations as connected traces rather than isolated log entries. A single trace shows you that an image pull took 45 seconds, followed by a 10-second volume mount, making it immediately clear where your pod startup time is being spent. This is especially powerful when combined with your application traces, giving you true end-to-end observability from user request to container startup.
The Technical Deep Dive: OpenTelemetry Integration
KEP-2831 leverages OpenTelemetry for its tracing implementation, following the established pattern used throughout the Kubernetes ecosystem.
Here’s what this means for platform teams:
Vendor Neutrality: Your Tools, Your Choice. By using OpenTelemetry, traces can be exported to any compatible backend—Jaeger, Zipkin, Grafana Tempo, or commercial solutions. This flexibility allows teams to choose the best tools for their needs without being locked into a specific vendor.
Ecosystem Compatibility: No More Silos. The integration ensures seamless compatibility with existing observability stacks, making it easier for teams to incorporate kubelet tracing into their current workflows and correlate infrastructure traces with application traces.
Standards-Based Approach. Using OpenTelemetry aligns with Kubernetes’ broader observability strategy and ensures kubelet tracing will benefit from ongoing improvements to the OpenTelemetry project.
With this integration, you can finally connect the dots between a slow API response in your application and a delayed volume mount on the node—providing the full-stack visibility that’s been missing from Kubernetes debugging.
Current Status: Beta and Production-Ready (With Caveats)
Let’s set the record straight on where KEP-2831 stands today. As of Kubernetes v1.27, kubelet tracing has reached Beta status, with General Availability targeted for v1.34 (releasing August 27, 2025).
What Beta means for you:
- ✅ Production use is supported (though not recommended for mission-critical workloads without careful monitoring).
- ⚠️ API changes are possible but unlikely to be breaking.
- 🔄 Feature flags may be required depending on your Kubernetes distribution.
- 📈 Active development continues with community feedback driving improvements.
For early adopters and platform teams looking to gain a competitive advantage in observability, now is an excellent time to start experimenting. Just ensure you have rollback plans and aren’t betting critical operations on Beta features.
Real-World Impact: Beyond Individual Clusters
The implications of kubelet tracing extend far beyond solving individual debugging sessions. This capability represents a fundamental shift in how we approach Kubernetes observability at scale.
For Platform Teams
- Faster incident resolution: Trace-driven debugging reduces MTTR significantly.
- Proactive optimization: Identify performance bottlenecks before they impact users.
- Better capacity planning: Understand actual resource utilization patterns at the node level.
For the Cloud-Native Ecosystem
KEP-2831 positions Kubernetes as a leader in infrastructure observability. As organizations increasingly adopt cloud-native architectures, the ability to trace operations across the entire stack—from application code down to container runtime interactions—becomes a competitive advantage.
This also aligns with the broader industry trend toward observability-driven development, where teams use telemetry data to inform architectural decisions and optimize system performance proactively.
Getting Started: What You Need to Know
Ready to experiment with kubelet tracing? Here’s your roadmap:
- Check your Kubernetes version: Ensure you’re running v1.27 or later.
- Configure OpenTelemetry: Set up your preferred tracing backend.
- Enable the feature: Configure kubelet tracing through feature gates or configuration files.
- Start small: Begin with non-production clusters to understand the data volume and performance impact.
Keep an eye on the Kubernetes release notes and engage with the community through SIG Node discussions for the latest updates and best practices.
The Future of Kubernetes Observability
KEP-2831 isn’t just about adding another observability tool—it’s about completing the observability story for Kubernetes. By bridging the gap between application-level and infrastructure-level tracing, it enables a new level of system understanding that wasn’t possible before.
Kubernetes 1.34 Release Timeline
The journey to GA is well underway with these key milestones:
- Enhancements Freeze: June 20, 2025 - All KEPs locked in
- Code Freeze: July 25, 2025 - Implementation complete
- GA Release: August 27, 2025 - Kubelet tracing becomes production-ready
As we approach the v1.34 GA release, expect to see:
- Enhanced integration with popular observability platforms.
- Performance optimizations to reduce overhead.
- Additional instrumentation points based on community feedback.
For DevOps engineers, platform engineers, and SREs, kubelet tracing represents an opportunity to level up your debugging capabilities and gain deeper insights into your Kubernetes infrastructure. The question isn’t whether you should adopt it—it’s how quickly you can start experimenting and learning.
The future of Kubernetes observability is here, and it’s more transparent than ever.
Stay ahead in cloud native
Tutorials, deep dives, and curated events. No fluff.
Related Articles
apko + melange: Distroless OCI Images Your Scanner Can Actually Read
Package, assemble, sign. No Dockerfile, no shell, no surprises.

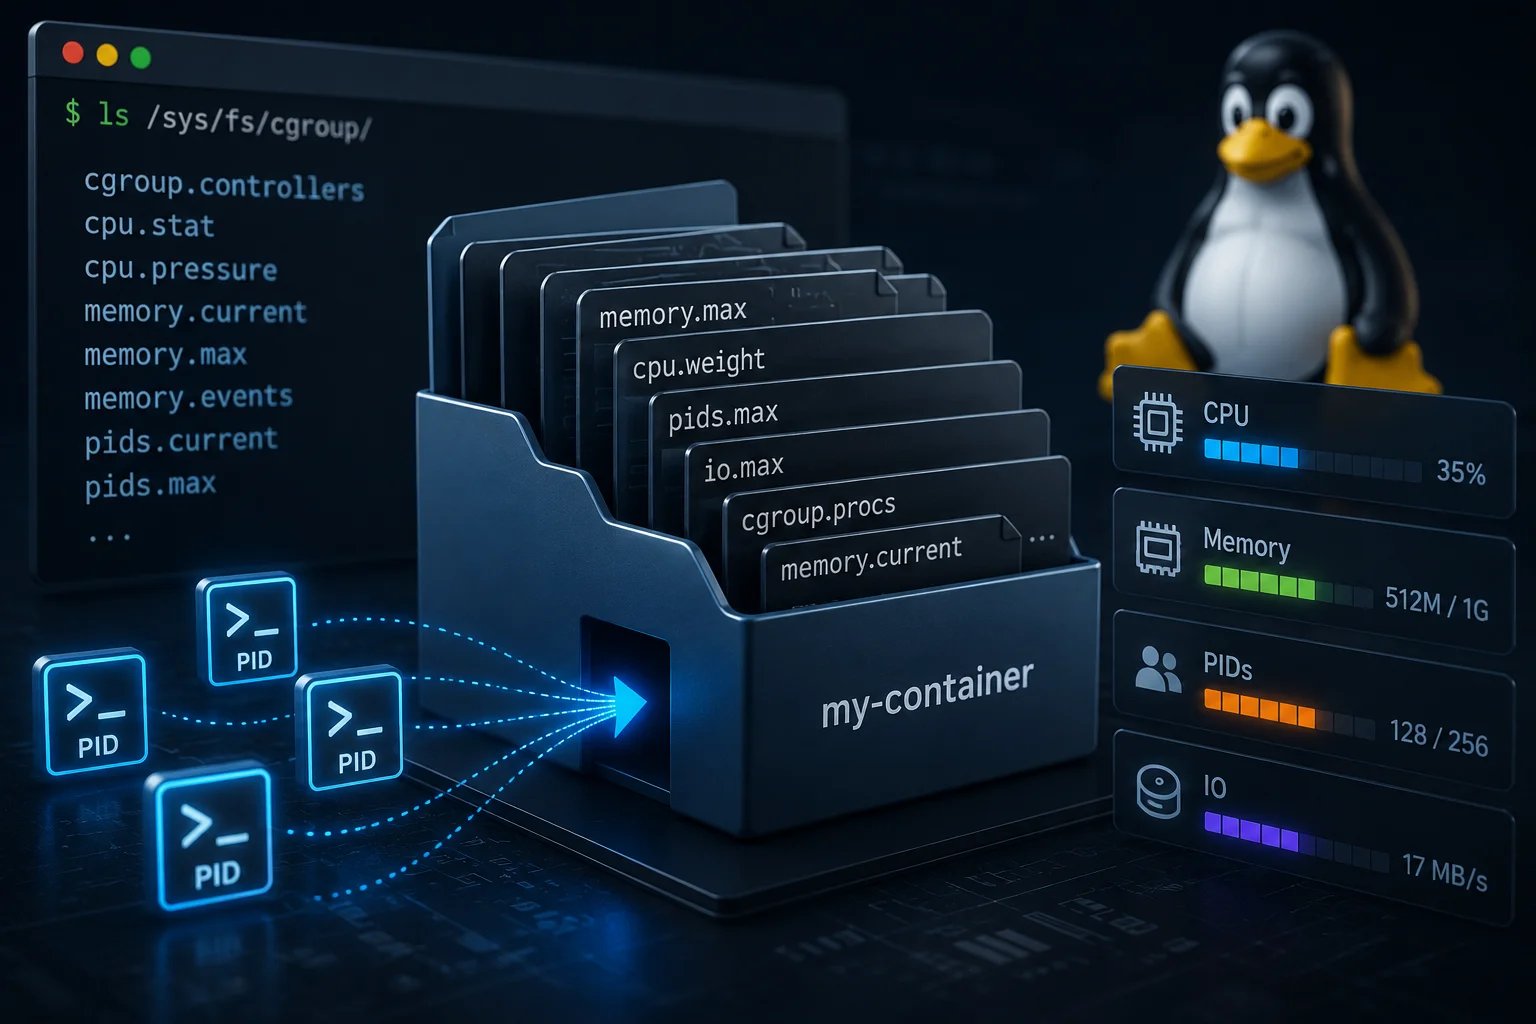
cgroups: From Chaos to Control
The kernel subsystem under every container
Introducing the Technology Matrix
A curated, interactive guide to the Cloud Native ecosystem